2017
Make & Model Rankings
Published by CarMD, December 2017
With the release of our 2017 CarMD® Vehicle Health Index™ Make & Model Reliability Rankings, we at CarMD® continue to strive toward excellence and innovation in the automotive repair solutions industry. We offer the only annual manufacturer and vehicle ranking system that statistically compares check engine failures and repair costs. While other industry reports often rely on subjective survey data, we base our figures on statistical analyses. This Index looks at the population of 1996 to current model year vehicles on the road, which is more comprehensive than many first-year owner surveys and studies.
This 2017 Index ranks brands and vehicles for frequency of check engine light problems and average cost of repairs for a large array of makes and models. It ranks the 10 brands with the lowest repair incidents/lowest average car repair costs, 100 vehicles by year, make and model with the fewest repair incidents/lowest average repair costs, and top three vehicles by category. Historical rankings are not necessarily indicative of future vehicle reliability.
To achieve this unmatched level of accuracy, we have analyzed the check engine health of more than 4.2 million models that span from 1996 to 2017. Each data point was administered on real in-use vehicles reporting check engine health between Oct. 1, 2016 and Sept. 30, 2017. Consumers, used car buyers and fleet managers have a goal to minimize vehicle upkeep, while OE manufacturers and aftermarket providers look to increase their knowledge of trends within the industry. This Index offers insight to improve on what every consumer and business cares about – the bottom line.
Highlights
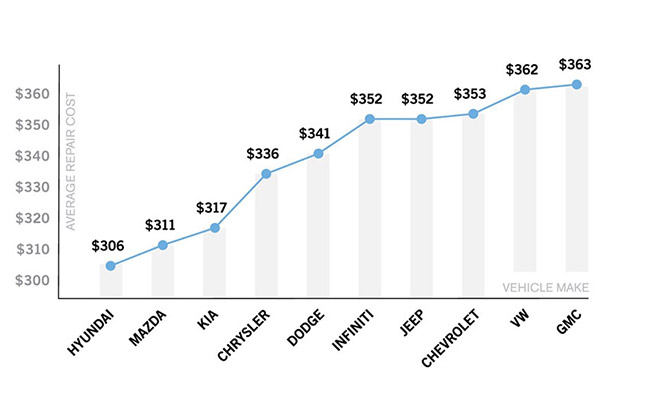
For the second consecutive year the vehicle brand with the lowest average repair cost for Check Engine was Hyundai, which had an average parts and labor repair estimate of $306 in 2017. The 2014 Elantra and Sonata both rank among the 10 vehicles with the lowest average repair costs.
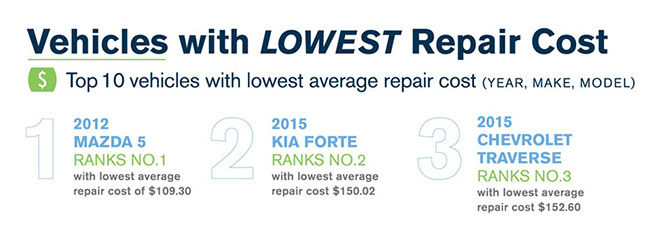
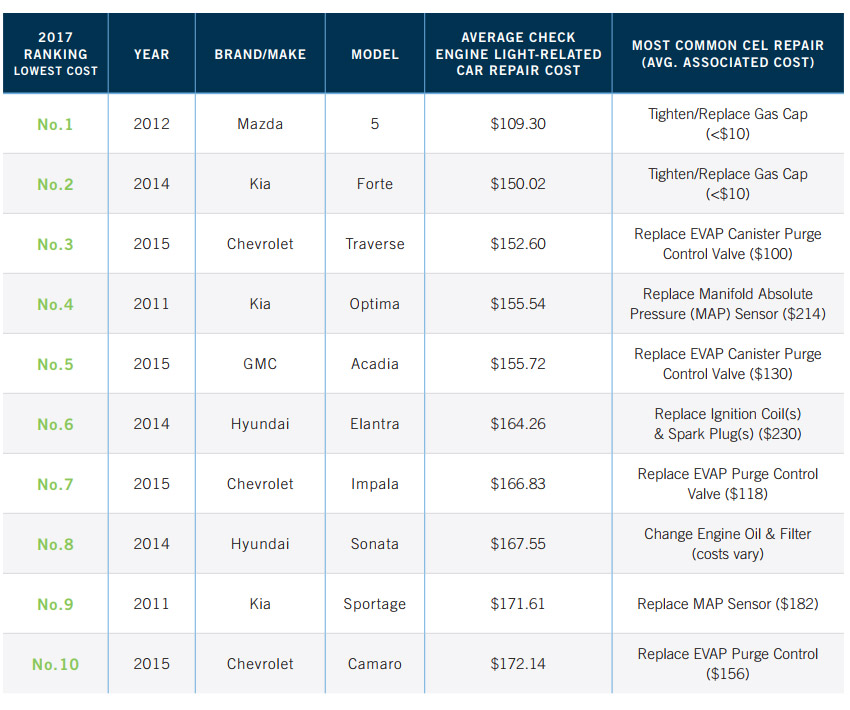
Among the vehicles with the lowest average car repair costs*, the 2012 Mazda 5, 2015 Kia Forte and 2015 Chevy Traverse rank tops, according to CarMD.
*vehicles must meet minimum vehicle population and data requirements of 1% to qualify for CarMD’s top 10 ranking.
The vehicle brand least likely to have a check engine light on in 2017 was Acura, which now ranks no. 1. Honda ranks no. 2 for the second consecutive year. Toyota is no. 3, down from its ranking in the top spot in 2016.

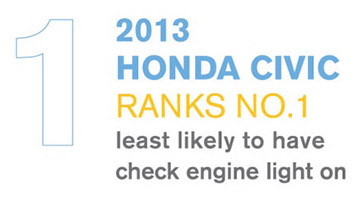
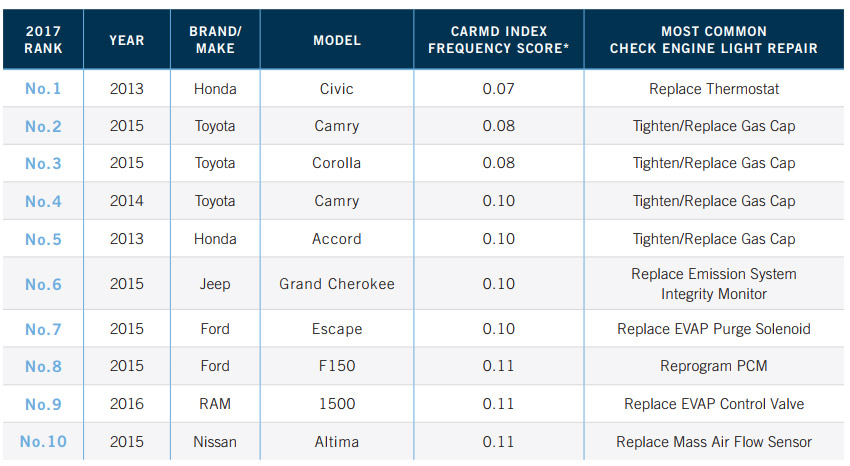
The 2013 Honda Civic is the vehicle least likely to have a check engine light on among the 8,900 different model year 1996 to 2017 vehicles analyzed by CarMD in 2017.

At least 10 percent of the cars and trucks on the road in the U.S. have a check engine light on at any given time, so chances are good that most vehicle owners will experience the hassle of needing a check engine light-related repair at some point. But which brands are least likely to need check engine repairs? To rank these brands, CarMD developed a formula that accounts for those with the lowest percentage of repair incidents per percentage of vehicle population. Based on this data, an Index frequency score is assigned. The lower the score the higher the vehicle make ranking.
CarMD found that over the past year when it comes to repair frequency Acura ranks no. 1, with a 1.40 CarMD Index frequency score. Acura is followed by Honda, which ranks no. 2 on the list for the second consecutive year. Toyota ranks no. 3 this year, down from its ranking in the top spot in 2016. Rounding out the top five brands least likely to need check engine light repairs are Mercedes and Mitsubishi.
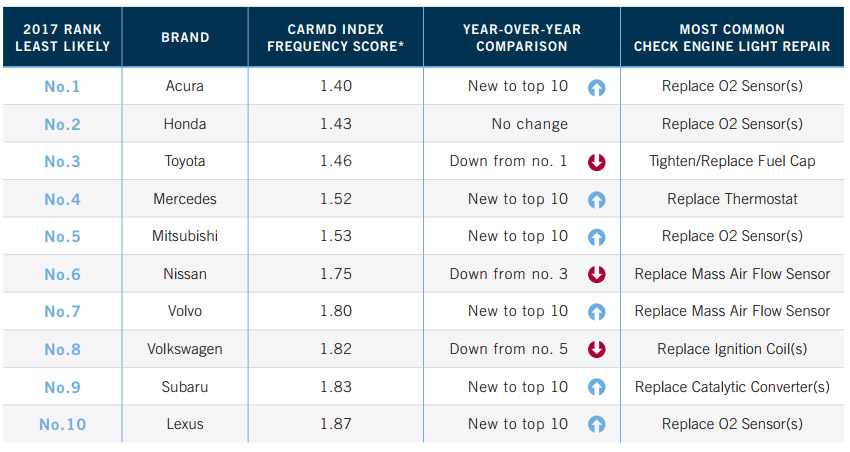
*The lower the Index frequency score, the higher the ranking.
(Top 10 vehicle makes by repair frequency based on model year 1996-2017 vehicles inspected between Oct. 1, 2016 and Sept. 30, 2017, and determined to have the fewest percentage of CarMD repair incidents, per vehicle population. Sources: CarMD.com Corp., with vehicle population data provided by R.L. Polk. )

Any given brand can have a mix of very reliable vehicles along with some that are inherently known to have more frequent issues. For this reason, our Index drills down to rank vehicles by year, make and model. Three Toyotas, two Fords, two Hondas, one Jeep, one Nissan and one RAM truck comprise this list of 10 vehicles with the lowest check engine light-related repair frequency among the 8,900 different model year 1996 to 2017 vehicles on the road over the past year.

Cars and trucks will need repairs from time to time. Of the 4.2 million vehicles analyzed by CarMD for needing repairs this past year, which makes cost their owners the least? CarMD found that the brand with the lowest average check engine light-related repair cost again this year was Hyundai at an average cost of $306, which is nearly 4 percent less than last year. Mazda ($310) remained the brand with the second lowest repair cost, and Kia ($317) retained its third-place ranking. Chrysler and Dodge rounded out the top five, ranking fourth and fifth respectively. New to the list this year are Infiniti and Volkswagen, which debut at no. 6 and no. 9 respectively.
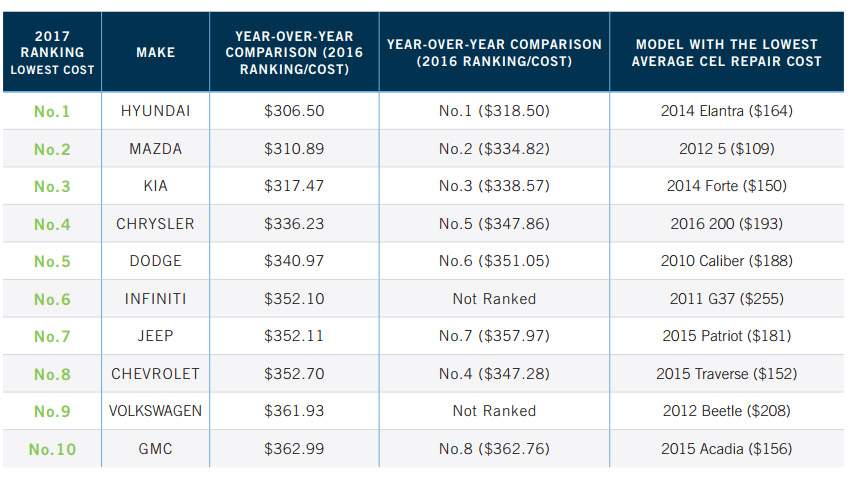
(Top 10 vehicle manufacturers based on model year 1996-2017 vehicles inspected by CarMD’s network, found to need repairs and receiving parts and labor estimates between Oct. 1, 2016 and Sept. 30, 2017.)

When the check engine light comes on, here is the list of the 10 vehicles with the lowest average repair cost among the 8,900 different year, make and model vehicles on the road today. Many drivers are surprised to learn that a loose, damage or missing gas cap is one of the most common check engine light triggers. Vehicles that have a high percentage of finicky gas caps often have lower average repair costs, but spend time getting it diagnosed nonetheless.

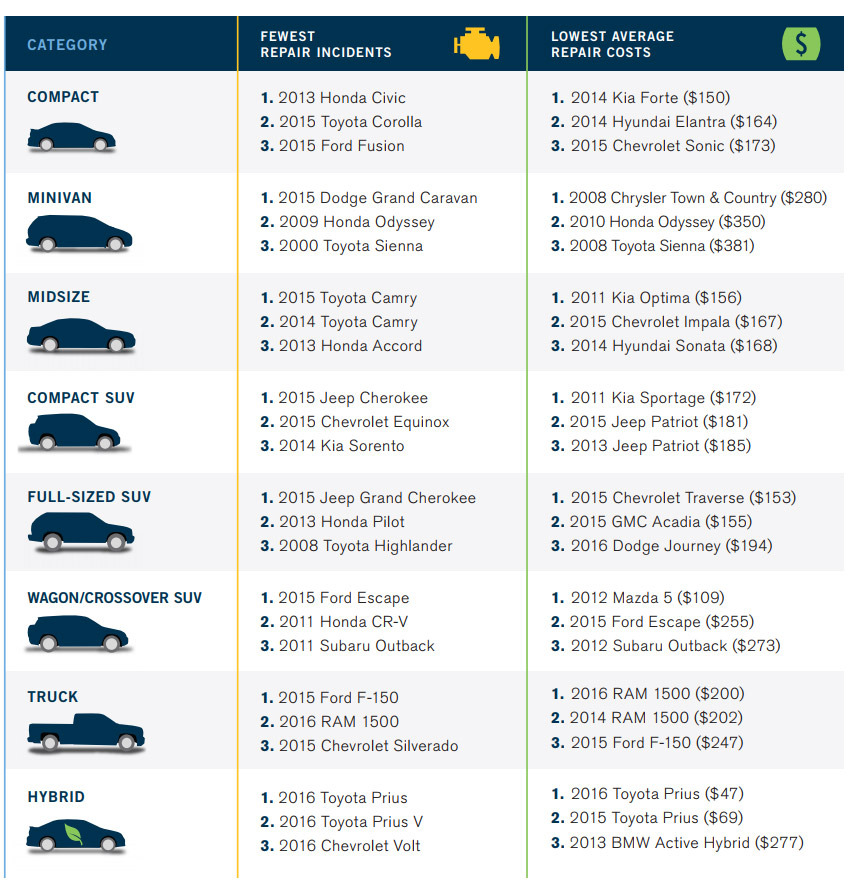
The following is a list of the top three vehicles by category using data reported from Oct. 1, 2016 through Sept. 30, 2017, according to CarMD, which based its ranking on the vehicles with the fewest and those with the lowest cost check engine-related problems reported by or to our network:
Wait, there’s more
If you’re interested in more info on the current state of vehicle health, download the PDF below. What you see on this page is only about 10% of all the info we have to offer – don’t miss the rest!
Stats
By ranking vehicles
(The Top 100 Vehicles in the U.S. (MY 1996-2017) with the fewest “check engine”-related problems reported from Oct. 1, 2016 and Sept. 30, 2017)
| Rank | Year | Make | Model | Index Frequency Score |
|---|---|---|---|---|
| 1. | 2013 | HONDA | CIVIC | 0.07 |
| 2. | 2015 | TOYOTA | CAMRY | 0.08 |
| 3. | 2015 | TOYOTA | COROLLA | 0.08 |
| 4. | 2014 | TOYOTA | CAMRY | 0.10 |
| 5. | 2013 | HONDA | ACCORD | 0.10 |
| 6. | 2015 | JEEP | GRAND CHEROKEE | 0.10 |
| 7. | 2015 | FORD | ESCAPE | 0.10 |
| 8. | 2015 | FORD | F150 | 0.11 |
| 9. | 2016 | RAM | 1500 | 0.11 |
| 10. | 2015 | NISSAN | ALTIMA | 0.11 |
| 11. | 2016 | JEEP | CHEROKEE | 0.12 |
| 12. | 2011 | HONDA | CR-V | 0.13 |
| 13. | 2012 | TOYOTA | CAMRY | 0.14 |
| 14. | 2015 | CHEVROLET | SILVERADO | 0.14 |
| 15. | 2012 | HONDA | CIVIC | 0.15 |
| 16. | 2015 | CHEVROLET | EQUINOX | 0.15 |
| 17. | 2014 | FORD | F150 | 0.15 |
| 18. | 2015 | GMC | SIERRA | 0.16 |
| 19. | 2013 | TOYOTA | CAMRY | 0.16 |
| 20. | 2014 | TOYOTA | COROLLA | 0.17 |
| 21. | 2015 | FORD | FUSION | 0.17 |
| 22. | 2015 | FORD | FOCUS | 0.17 |
| 23. | 2014 | HYUNDAI | SONATA | 0.18 |
| 24. | 2007 | TOYOTA | PRIUS | 0.18 |
| 25. | 2015 | HYUNDAI | SONATA | 0.19 |
| 26. | 2015 | JEEP | CHEROKEE | 0.19 |
| 27. | 2014 | FORD | ESCAPE | 0.20 |
| 28. | 2015 | NISSAN | SENTRA | 0.20 |
| 29. | 2015 | KIA | SOUL | 0.21 |
| 30. | 2013 | TOYOTA | COROLLA | 0.21 |
| 31. | 2014 | HYUNDAI | ELANTRA | 0.21 |
| 32. | 2016 | CHEVROLET | MALIBU | 0.21 |
| 33. | 2013 | HONDA | PILOT | 0.21 |
| 34. | 2014 | FORD | EXPLORER | 0.21 |
| 35. | 2014 | FORD | FUSION | 0.21 |
| 36. | 2012 | HONDA | ACCORD | 0.22 |
| 37. | 2011 | HONDA | CIVIC | 0.22 |
| 38. | 2010 | HONDA | CIVIC | 0.22 |
| 39. | 2009 | TOYOTA | TACOMA | 0.22 |
| 40. | 2015 | FORD | F250 | 0.22 |
| 41. | 2009 | HONDA | CR-V | 0.23 |
| 42. | 2015 | FORD | MUSTANG | 0.23 |
| 43. | 2014 | NISSAN | ALTIMA | 0.23 |
| 44. | 2011 | TOYOTA | CAMRY | 0.24 |
| 45. | 2012 | TOYOTA | COROLLA | 0.24 |
| 46. | 2008 | TOYOTA | HIGHLANDER | 0.24 |
| 47. | 2014 | KIA | SORENTO | 0.25 |
| 48. | 2015 | JEEP | PATRIOT | 0.25 |
| 49. | 2011 | SUBARU | OUTBACK | 0.25 |
| 50. | 2013 | HYUNDAI | ELANTRA | 0.25 |
| 51. | 2013 | NISSAN | ROGUE | 0.25 |
| 52. | 2012 | TOYOTA | RAV4 | 0.25 |
| 53. | 2013 | HYUNDAI | SONATA | 0.25 |
| 54. | 2008 | HONDA | CR-V | 0.26 |
| 55. | 2008 | LEXUS | RX | 0.26 |
| 56. | 2010 | HONDA | CR-V | 0.27 |
| 57. | 2011 | TOYOTA | RAV4 | 0.27 |
| 58. | 2003 | TOYOTA | COROLLA | 0.27 |
| 59. | 2011 | TOYOTA | COROLLA | 0.27 |
| 60. | 2004 | TOYOTA | COROLLA | 0.27 |
| 61. | 2010 | TOYOTA | RAV4 | 0.28 |
| 62. | 2013 | KIA | SORENTO | 0.28 |
| 63. | 2014 | FORD | FOCUS | 0.28 |
| 64. | 2015 | NISSAN | VERSA | 0.29 |
| 65. | 2001 | DODGE | Ram 2500 | 0.29 |
| 66. | 2004 | FORD | F350 | 0.29 |
| 67. | 2014 | KIA | SOUL | 0.29 |
| 68. | 2004 | HONDA | PILOT | 0.30 |
| 69. | 2011 | HONDA | ACCORD | 0.30 |
| 70. | 2016 | CHEVROLET | CRUZE LIMITED | 0.30 |
| 71. | 2013 | KIA | OPTIMA | 0.30 |
| 72. | 2007 | HONDA | CR-V | 0.30 |
| 73. | 2014 | VOLKSWAGEN | JETTA | 0.30 |
| 74. | 2015 | FORD | F350 | 0.31 |
| 75. | 2004 | FORD | F250 | 0.31 |
| 76. | 2012 | FORD | FOCUS | 0.31 |
| 77. | 2010 | TOYOTA | COROLLA | 0.31 |
| 78. | 2014 | JEEP | CHEROKEE | 0.31 |
| 79. | 2012 | HONDA | PILOT | 0.31 |
| 80. | 2001 | TOYOTA | COROLLA | 0.31 |
| 81. | 2012 | FORD | ECONOLINE | 0.31 |
| 82. | 2015 | GMC | ACADIA | 0.32 |
| 83. | 2015 | DODGE | GRAND CARAVAN | 0.32 |
| 84. | 2012 | SUBARU | OUTBACK | 0.32 |
| 85. | 2012 | TOYOTA | TACOMA | 0.32 |
| 86. | 2014 | CHEVROLET | CAMARO | 0.32 |
| 87. | 2009 | HONDA | CIVIC | 0.33 |
| 88. | 2016 | DODGE | JOURNEY | 0.33 |
| 89. | 1999 | TOYOTA | COROLLA | 0.33 |
| 90. | 2004 | HONDA | ODYSSEY | 0.33 |
| 91. | 2001 | BUICK | LESABRE | 0.33 |
| 92. | 2014 | CHEVROLET | TRAVERSE | 0.34 |
| 93. | 2014 | NISSAN | SENTRA | 0.34 |
| 94. | 2012 | MAZDA | 3 | 0.34 |
| 95. | 2014 | CHEVROLET | SILVERADO | 0.34 |
| 96. | 2003 | TOYOTA | CAMRY | 0.34 |
| 97. | 2014 | JEEP | GRAND CHEROKEE | 0.35 |
| 98. | 2012 | TOYOTA | TUNDRA | 0.35 |
| 99. | 2003 | HONDA | PILOT | 0.36 |
| 100. | 2003 | HONDA | ODYSSEY | 0.36 |
(The Top 100 Vehicles in the U.S. (MY 1996-2017) with the lowest average “check engine”-related repair costs reported from Oct. 1, 2016 to Sept. 30, 2017)
| Rank | Year | Make | Model |
Average “Check Engine” Light-Related Repair Cost |
|---|---|---|---|---|
| 1. | 2012 | MAZDA | 5 | $109.30 |
| 2. | 2014 | KIA | FORTE | $150.02 |
| 3. | 2015 | CHEVROLET | TRAVERSE | $152.60 |
| 4. | 2011 | KIA | OPTIMA | $155.54 |
| 5. | 2015 | GMC | ACADIA | $155.72 |
| 6. | 2014 | HYUNDAI | ELANTRA | $164.26 |
| 7. | 2013 | FIAT | 500 | $164.57 |
| 8. | 2015 | CHEVROLET | IMPALA | $166.83 |
| 9. | 2014 | HYUNDAI | SONATA | $167.55 |
| 10. | 2011 | KIA | SPORTAGE | $171.61 |
| 11. | 2015 | CHEVROLET | CAMARO | $172.14 |
| 12. | 2015 | CHEVROLET | SONIC | $173.27 |
| 13. | 2009 | HYUNDAI | ACCENT | $173.95 |
| 14. | 2010 | HYUNDAI | ACCENT | $174.51 |
| 15. | 2013 | KIA | FORTE | $176.43 |
| 16. | 2008 | HYUNDAI | ACCENT | $176.79 |
| 17. | 2007 | HYUNDAI | ACCENT | $176.95 |
| 18. | 2013 | HYUNDAI | ACCENT | $178.16 |
| 19. | 2009 | KIA | OPTIMA | $178.37 |
| 20. | 2015 | JEEP | PATRIOT | $181.19 |
| 21. | 2012 | HONDA | CIVIC | $183.67 |
| 22. | 2013 | JEEP | PATRIOT | $185.00 |
| 23. | 2015 | CHEVROLET | MALIBU | $185.54 |
| 24. | 2013 | HYUNDAI | ELANTRA | $186.36 |
| 25. | 2010 | DODGE | CALIBER | $188.09 |
| 26. | 2014 | CHEVROLET | CAPTIVA | $188.56 |
| 27. | 2015 | CHEVROLET | IMPALA LIMITED | $189.52 |
| 28. | 2013 | CHEVROLET | SPARK | $190.07 |
| 29. | 2011 | HYUNDAI | ACCENT | $192.34 |
| 30. | 2016 | CHRYSLER | 200 | $193.11 |
| 31. | 2010 | DODGE | AVENGER | $193.47 |
| 32. | 2001 | FORD | EXPLORER SPORT TRAC | $194.06 |
| 33. | 2016 | DODGE | JOURNEY | $194.16 |
| 34. | 2012 | HYUNDAI | ACCENT | $194.28 |
| 35. | 2002 | FORD | EXPLORER SPORT TRAC | $195.11 |
| 36. | 2014 | JEEP | COMPASS | $196.37 |
| 37. | 2014 | CHEVROLET | MALIBU | $198.84 |
| 38. | 2015 | FORD | MUSTANG | $199.18 |
| 39. | 2014 | CHEVROLET | IMPALA LIMITED | $199.41 |
| 40. | 2014 | JEEP | PATRIOT | $200.30 |
| 41. | 2016 | RAM | 1500 | $200.55 |
| 42. | 2013 | CADILLAC | ATS | $200.72 |
| 43. | 2012 | FIAT | 500 | $201.66 |
| 44. | 2013 | CHEVROLET | CAPTIVA | $202.05 |
| 45. | 2014 | RAM | 1500 | $202.43 |
| 46. | 2010 | CHRYSLER | SEBRING | $202.85 |
| 47. | 2014 | CHRYSLER | 200 | $202.89 |
| 48. | 2015 | TOYOTA | CAMRY | $203.77 |
| 49. | 2011 | JEEP | COMPASS | $204.25 |
| 50. | 2013 | TOYOTA | CAMRY | $204.80 |
| 51. | 2010 | KIA | SOUL | $205.43 |
| 52. | 2011 | KIA | FORTE | $205.44 |
| 53. | 2013 | KIA | OPTIMA | $206.51 |
| 54. | 2011 | KIA | SORENTO | $207.21 |
| 55. | 2014 | HYUNDAI | ACCENT | $207.27 |
| 56. | 2013 | CHRYSLER | 200 | $207.68 |
| 57. | 2016 | CHEVROLET | MALIBU | $208.02 |
| 58. | 2012 | VOLKSWAGEN | BEETLE | $208.33 |
| 59. | 2005 | CHEVROLET | COBALT | $208.36 |
| 60. | 2013 | GMC | ACADIA | $209.33 |
| 61. | 2013 | HONDA | CIVIC | $210.18 |
| 62. | 2012 | JEEP | PATRIOT | $210.22 |
| 63. | 2014 | DODGE | AVENGER | $210.63 |
| 64. | 2011 | DODGE | CALIBER | $210.64 |
| 65. | 2005 | DODGE | NEON | $211.83 |
| 66. | 2013 | BUICK | LACROSSE | $211.87 |
| 67. | 2013 | HYUNDAI | SONATA | $212.10 |
| 68. | 2011 | JEEP | PATRIOT | $212.11 |
| 69. | 2012 | BUICK | LACROSSE | $212.91 |
| 70. | 2009 | KIA | RIO | $213.17 |
| 71. | 2013 | CHEVROLET | IMPALA | $215.44 |
| 72. | 2008 | GMC | ENVOY | $215.64 |
| 73. | 2003 | DODGE | NEON | $215.74 |
| 74. | 2013 | KIA | RIO | $215.79 |
| 75. | 1996 | FORD | ECONOLINE | $216.32 |
| 76. | 2004 | DODGE | NEON | $217.50 |
| 77. | 2013 | VOLKSWAGEN | CC | $218.20 |
| 78. | 2012 | HYUNDAI | SONATA | $218.61 |
| 79. | 2010 | JEEP | WRANGLER | $218.92 |
| 80. | 2001 | FORD | EXPLORER | $219.37 |
| 81. | 2012 | CADILLAC | CTS | $219.41 |
| 82. | 2012 | BUICK | REGAL | $219.57 |
| 83. | 2012 | JEEP | COMPASS | $219.96 |
| 84. | 2013 | FORD | MUSTANG | $220.16 |
| 85. | 2008 | KIA | RIO | $220.78 |
| 86. | 2011 | HONDA | CIVIC | $221.94 |
| 87. | 2013 | CHEVROLET | TRAVERSE | $222.82 |
| 88. | 2001 | FORD | RANGER | $223.24 |
| 89. | 2013 | DODGE | AVENGER | $223.60 |
| 90. | 2015 | CHEVROLET | CRUZE | $224.05 |
| 91. | 2011 | KIA | SOUL | $224.25 |
| 92. | 2014 | TOYOTA | CAMRY | $224.34 |
| 93. | 2002 | FORD | RANGER | $224.51 |
| 94. | 2012 | KIA | FORTE | $225.69 |
| 95. | 2009 | HYUNDAI | SANTA FE | $226.06 |
| 96. | 2006 | CHEVROLET | COBALT | $226.50 |
| 97. | 1999 | FORD | WINDSTAR | $227.47 |
| 98. | 2010 | DODGE | CHALLENGER | $228.78 |
| 99. | 2011 | TOYOTA | CAMRY | $229.94 |
| 100. | 2006 | TOYOTA | CAMRY SOLARA | $230.29 |

